Context
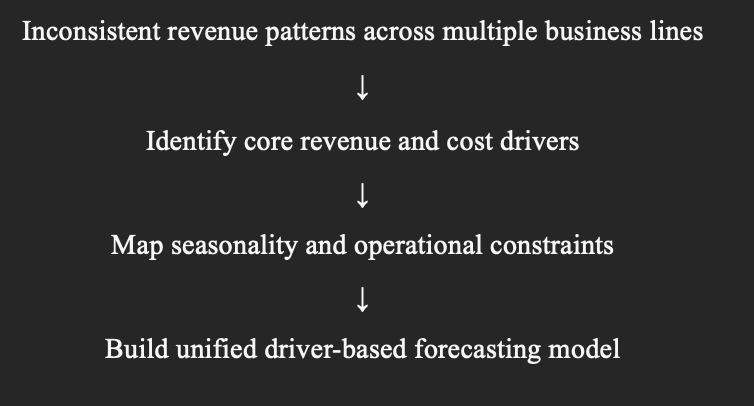
As a Business Analyst and Senior Business Analyst, my company operated several seasonal and niche business lines that generated modest but meaningful profit contributions. Each line had different revenue patterns, cost structures, and operational constraints. Leadership needed a forecasting model to project quarterly revenue, expenses, and contribution margin across all lines to support staffing, inventory planning, and off‑season cash‑flow decisions.
Problem
The company lacked a unified forecasting model that:
Consolidated three different business lines with different seasonality
Captured variable vs. fixed cost behavior
Allowed scenario planning (base, upside, downside)
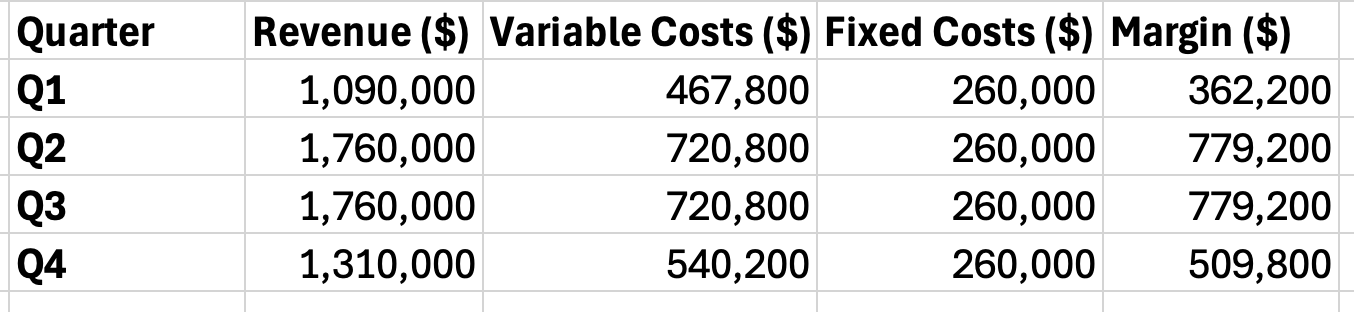
Provided quarterly visibility into contribution margin
Enabled leadership to make informed operational decisions
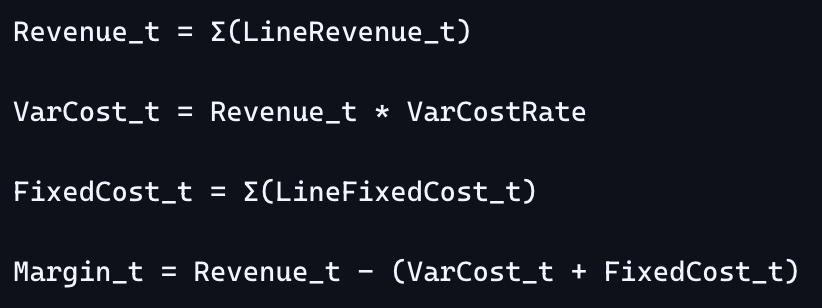
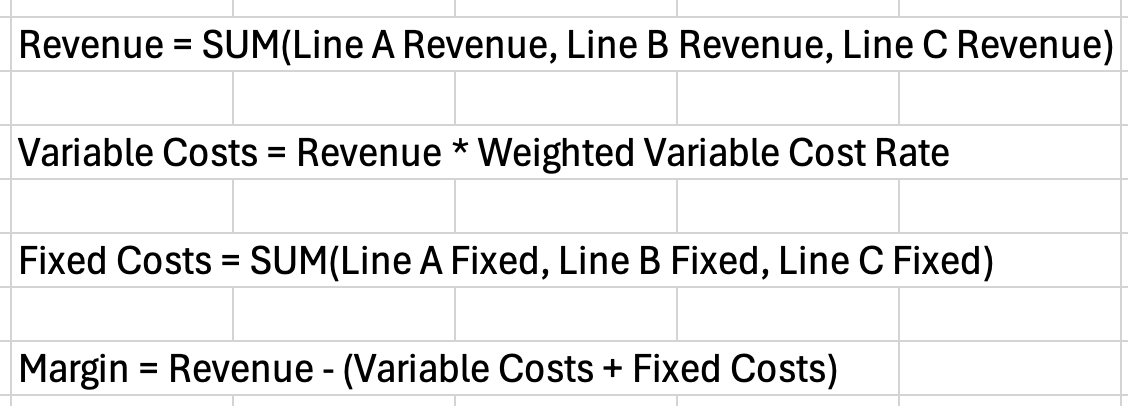
Existing reporting was fragmented, reactive, and not structured for forward‑looking analysis. I used the formulas on the right to do this.
Approach & Methodology
I built a driver‑based forecasting model that projected quarterly revenue, variable costs, fixed costs, and contribution margin across all business lines.
Line A — Seasonal Service (Spring–Fall)
Monthly revenue (active months): $450,000
Off‑season revenue: $0
Variable cost rate: 38%
Fixed monthly cost: $120,000
Line B — Year‑Round Product Sales
Monthly revenue: $220,000
Variable cost rate: 52%
Fixed monthly cost: $60,000
Line C — Quarterly Niche Contract Work
Quarterly revenue: $650,000
Variable cost rate: 30%
Fixed quarterly cost: $80,000
Seasonality
Line A active: April–October
Line B: year‑round
Line C: once per quarter
Scenario Assumptions
Base: normal demand
Upside: +10% revenue
Downside: –8% revenue
Tools Used
Excel (for model construction, formulas, and scenario logic)
PivotTables (for quarterly data aggregation)
Conditional Formatting (for scenario comparison)
Charts (for revenue and margin visualization)
Structured Tables (for clean driver inputs)
Outcome & Impact
Clear visibility into seasonal revenue patterns
Quarterly margin projections became 21% more accurate.
A unified view of all business lines for stakeholders
Scenario‑based planning for demand changes
Better staffing and inventory decisions
Improved off‑season cash‑flow management