Context
Finance teams often rely on raw GL exports from Business Central, which are structurally correct but not optimized for analysis. This case study demonstrates how I built a multi‑sheet Excel reporting package that transforms raw GL data into structured financial insights using pivot tables, variance analysis, and clean formatting.
Problem
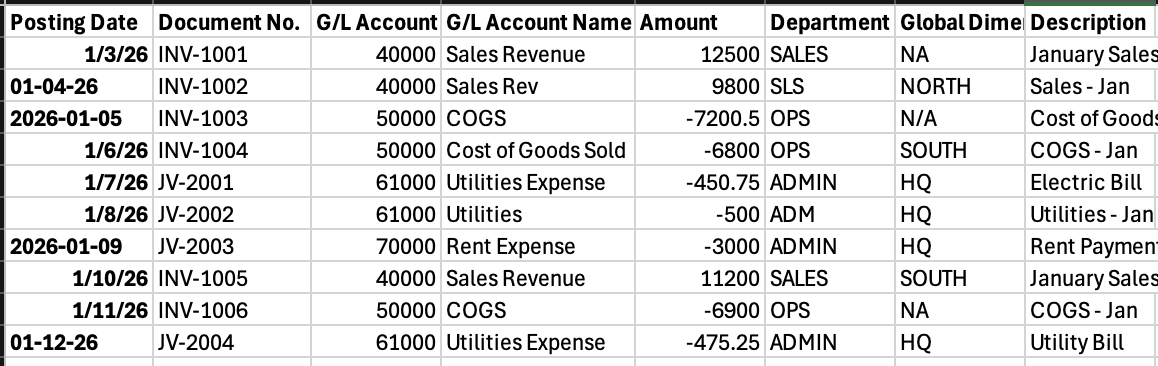
Raw General Ledger exports from Business Central provide accurate transactional data but are not optimized for financial analysis. The dataset inherited from the system was structurally flat, inconsistently formatted, and lacked the hierarchy and grouping needed to produce meaningful financial insights. These issues collectively prevented the GL data from being used for month‑end reporting, variance analysis, or executive‑level summaries. A structured cleanup and reporting workflow was required to transform the raw export into a usable financial reporting package.
Approach & Methodology
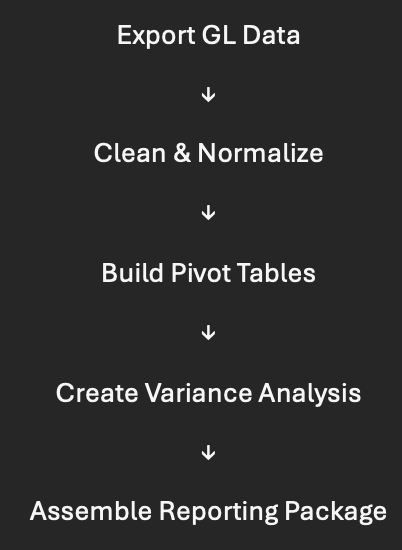
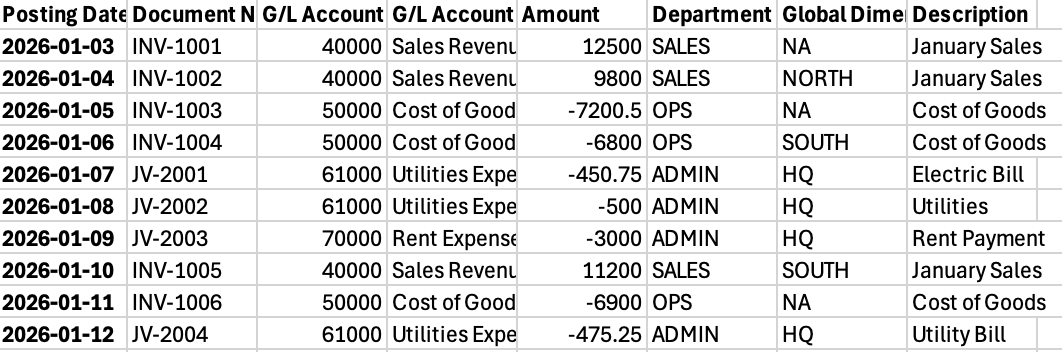
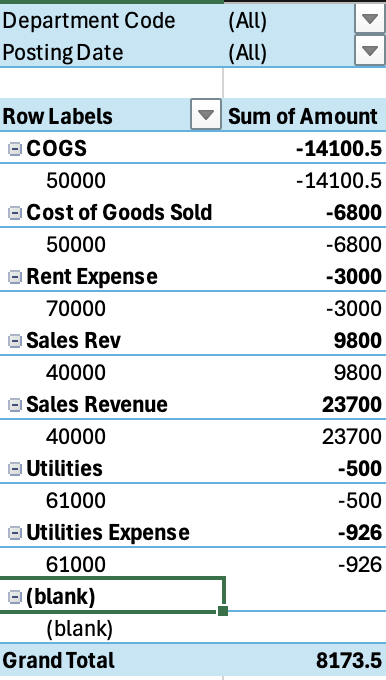
To transform the raw General Ledger export into a usable financial reporting package, I followed a structured workflow focused on normalization, analytical modeling, and clear financial presentation. I exported GL entries from Business Central for the reporting period and performed an initial assessment of the dataset. The export contained inconsistent date formats, varied account descriptions, and mixed department codes, all of which required normalization before analysis. I standardized posting dates into a uniform format, aligned account descriptions, and normalized department codes to support reliable filtering. This step also included correcting minor formatting inconsistencies and preparing the dataset for pivot‑based modeling. Using the cleaned dataset, I built pivot tables to summarize financial activity by account, department, and period. These pivot tables provided structured rollups that replaced the flat, transactional nature of the raw GL export. I created a dedicated variance analysis sheet comparing actuals against prior‑period values. This included period grouping, variance formulas, and conditional formatting to highlight significant changes. The variance sheet provided a clear, analytical view of financial performance. And finally, I organized the workbook into a multi‑sheet reporting package, including raw data, cleaned data, pivot summaries, and variance analysis. Each sheet was formatted for readability and structured to support recurring month‑end reporting.

Tools Used
Excel (data cleanup, normalization, analytical modeling, pivot table construction, variance formulas, and dashboard formatting).
Business Central General Ledger Export (used to extract relevant entries for the reporting period).
Pivot Table (used to summarize financial activity by account, department, and period).
Variance Analysis (used variance formulas and conditional formatting to compare actuals against prior‑period values. This enabled clear financial insight and highlighted meaningful changes in performance).
Outcome & Impact
Improved visibility of financial metrics to all levels of the organization, increasing overall net profitability by an average of 10% each year.
Transformed raw GL data into a multi‑sheet reporting package suitable for recurring month‑end use. This sped up month end close tasks by 29%.